
MI reporting is an essential tool for making business decisions and improving the way we work. HubSolv is an extension of your business, which stores valuable data. You can utilise this data to track performance across campaigns, clients and users. The MI report can be customised to pull, compare and breakdown data. The user-friendly dashboard has a colourful design and gives you instant results.
Please watch this video tutorial to find out more:
What is a filter group?
A filter group allows you to group multiple client data filters, providing you with a count of the filtered results. You can filter data through the below options;
- Campaign
- Status
- User
- Lead Source
- Lead Generator
- Lead Type
By filtering, you can capture the data that is most important to you. you can also modify timeframes as to when a case was added or when a certain status was set by using the more options link below the filters.
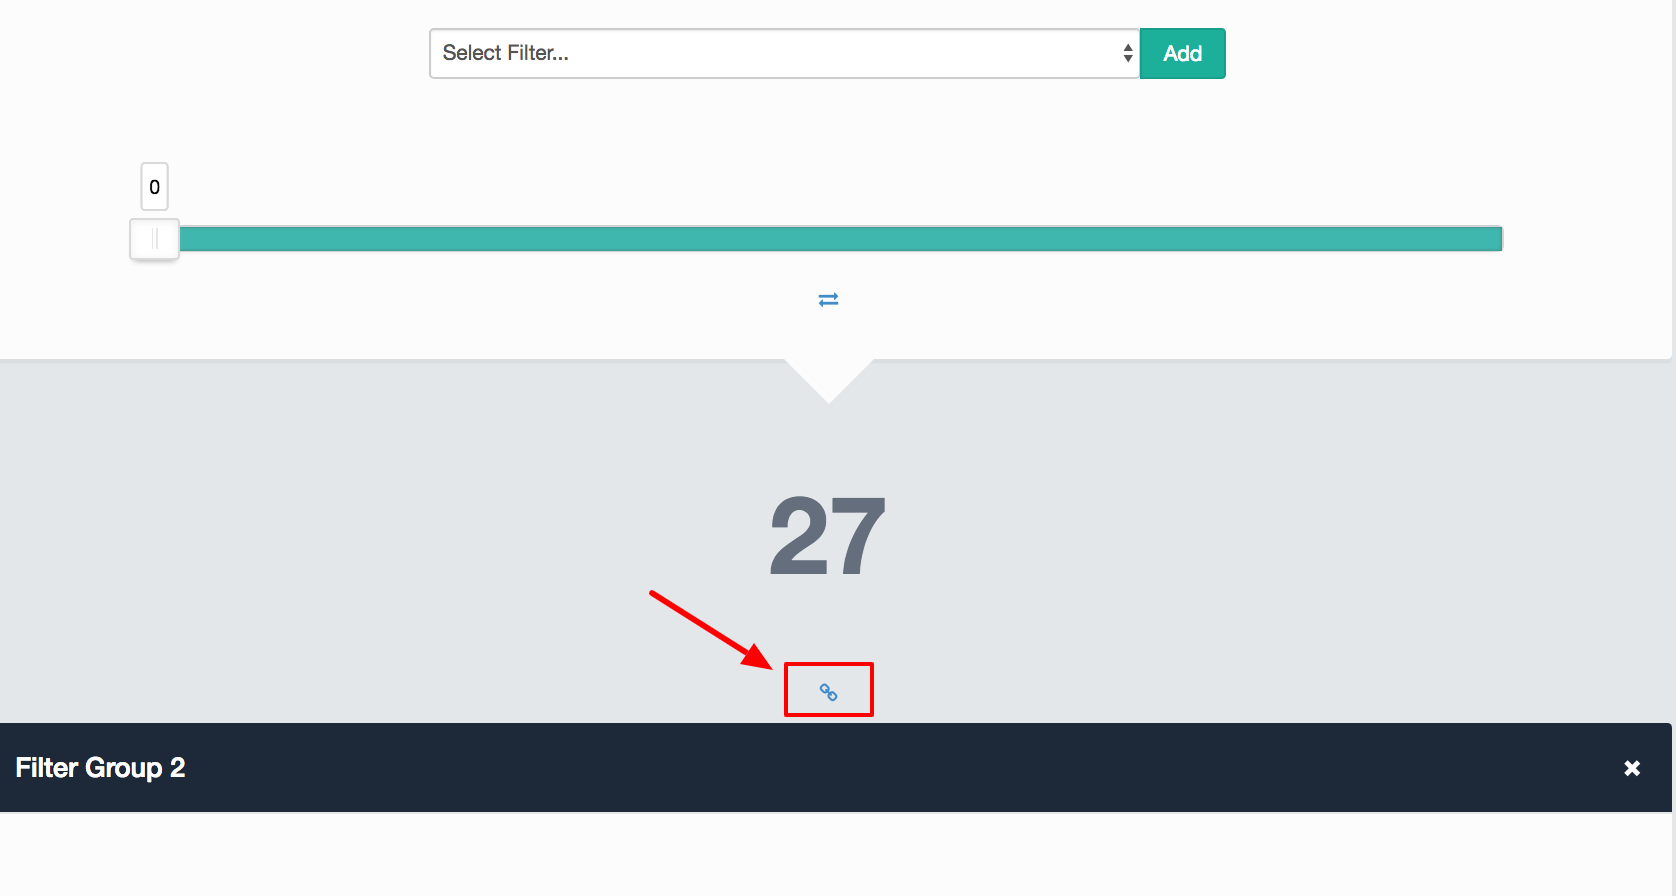
Linking and unlinking filter groups
Linking or unlinking filter groups is done by clicking the chain icon. Linking a filter group to the previous will further filter down the data.
An example of linked filter groups might be;
Leads in this Month (1st Filter Group)
Filter: Campaign (Leads), Added this month
Result: 300
Of Which Appointment Booked (2nd Filter Group)
Filter: Status (“Appointment Booked”)
Result: 150
Of Which Signed (3nd Filter Group)
Filter: Status (“Signed”)
Result: 50
In this example, we are showing leads that have been added to the leads campaign this month. Of the 300 leads, 150 have had appointments booked, and of those 150, 50 have signed.
An example of unlinked filter groups (what we call a comparison report) might be;
Signed Last Month (1st Filter Group)
Filter: Status (“Signed”), Date set “Last Month”
Results: 89
Signed This Month (2st Filter Group)
Filter: Status (“Signed”), Date set “This Month”
Results: 97
In this example, each filter group is filtering the client data on the system independently i.e. not filtering the previous result data. This example compares last month’s signed cases to the current month's cases.
Target Ranges
The target range slider allows you to colour code the filter group results that appear on the user’s dashboard as a Wallboard.
There are two types of range;
- Fixed
This allows you to specify fixed target ranges. - Percentage (Can be used in linked filter groups)
This allows you to specify a percentage range, which works out a percentage based on the previous filter group total.
Note: You can double click on the upper range value to type in a value greater than the default upper limit of 500. The first Filter Group will have a fixed target range to base potential percentages on for subsequent filter groups.
Saving or exporting Reports:
To export a report, press the export button and select the data you would like to save.
To save a report on your dashboard please ensure you select the users you would like to view the report on the saving options.
If you have any questions please email helpdesk@hubsolv.com
Comments
0 comments
Article is closed for comments.