Building reports in HubSolv can be done through our MI Report Builder which allows you to filter data down through funnels to show conversions. You can of course just show the raw data if you don't want to convert it downwards.
Filters
To show for example Packed Out Clients for today, you can select different filters such as:
- Campaign
- Status
- User
- Lead Source
- Lead Generator
- Lead Type
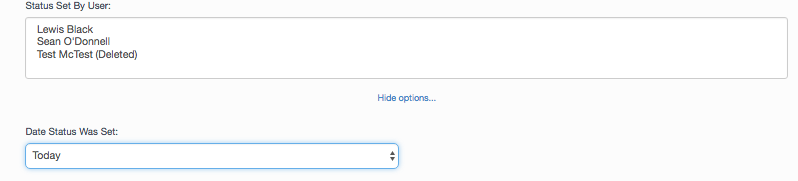
By filtering to these you can grab the data that is most important to you, you can also modify times as to when a case was added or a status was set by using the more options link below the filters.
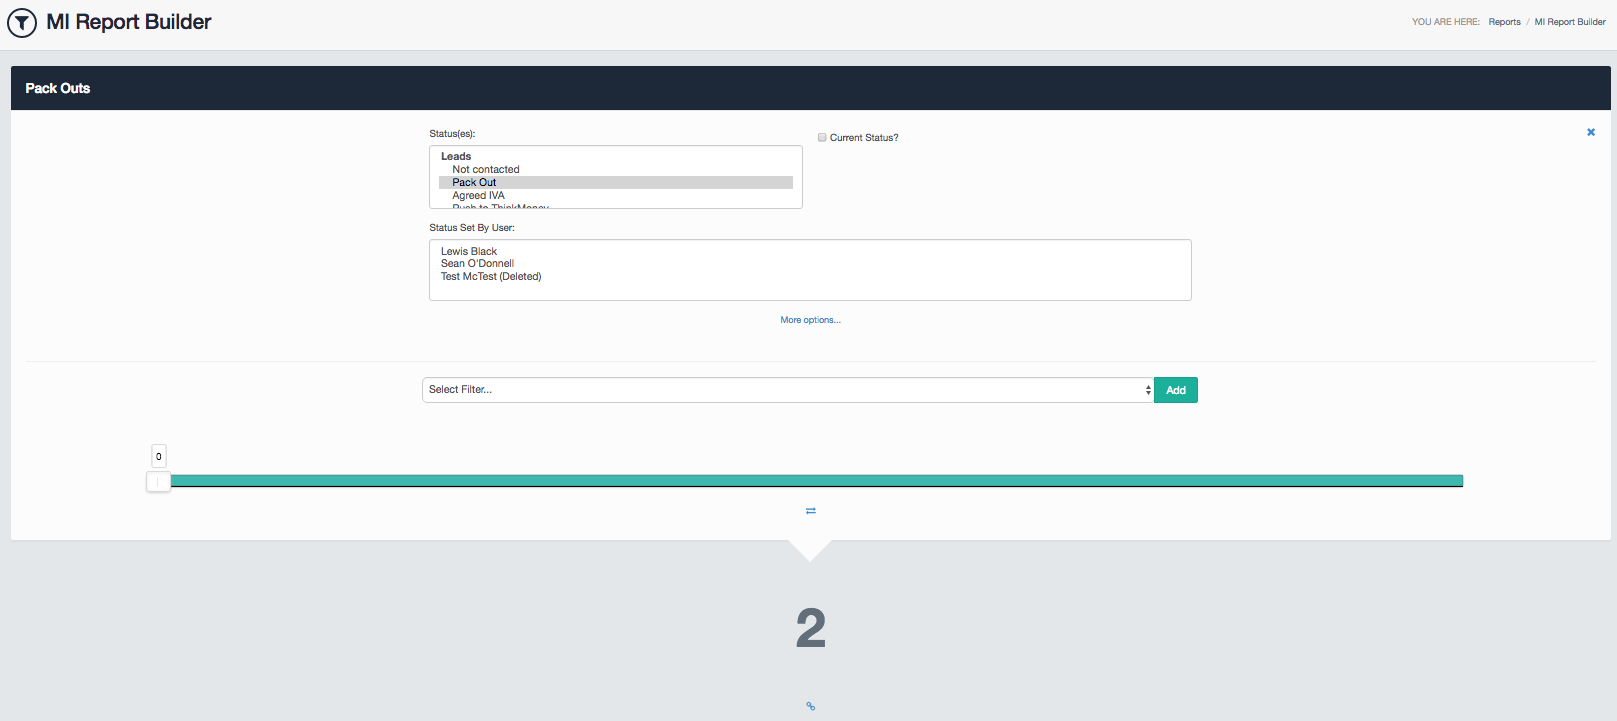
As you can see, I've selected the Pack Out status under leads, and unchecked the current status box. This will provide me with all leads that have been packed out no matter if the status is set to packout or not. If I wanted to I could also filter by the date this status was set by using the more options section, or even who set that status.
Conversion/Filter Groups
If you want to then convert these Packed Out cases into perhaps a Paid status, you can add another filter group and show the conversion.
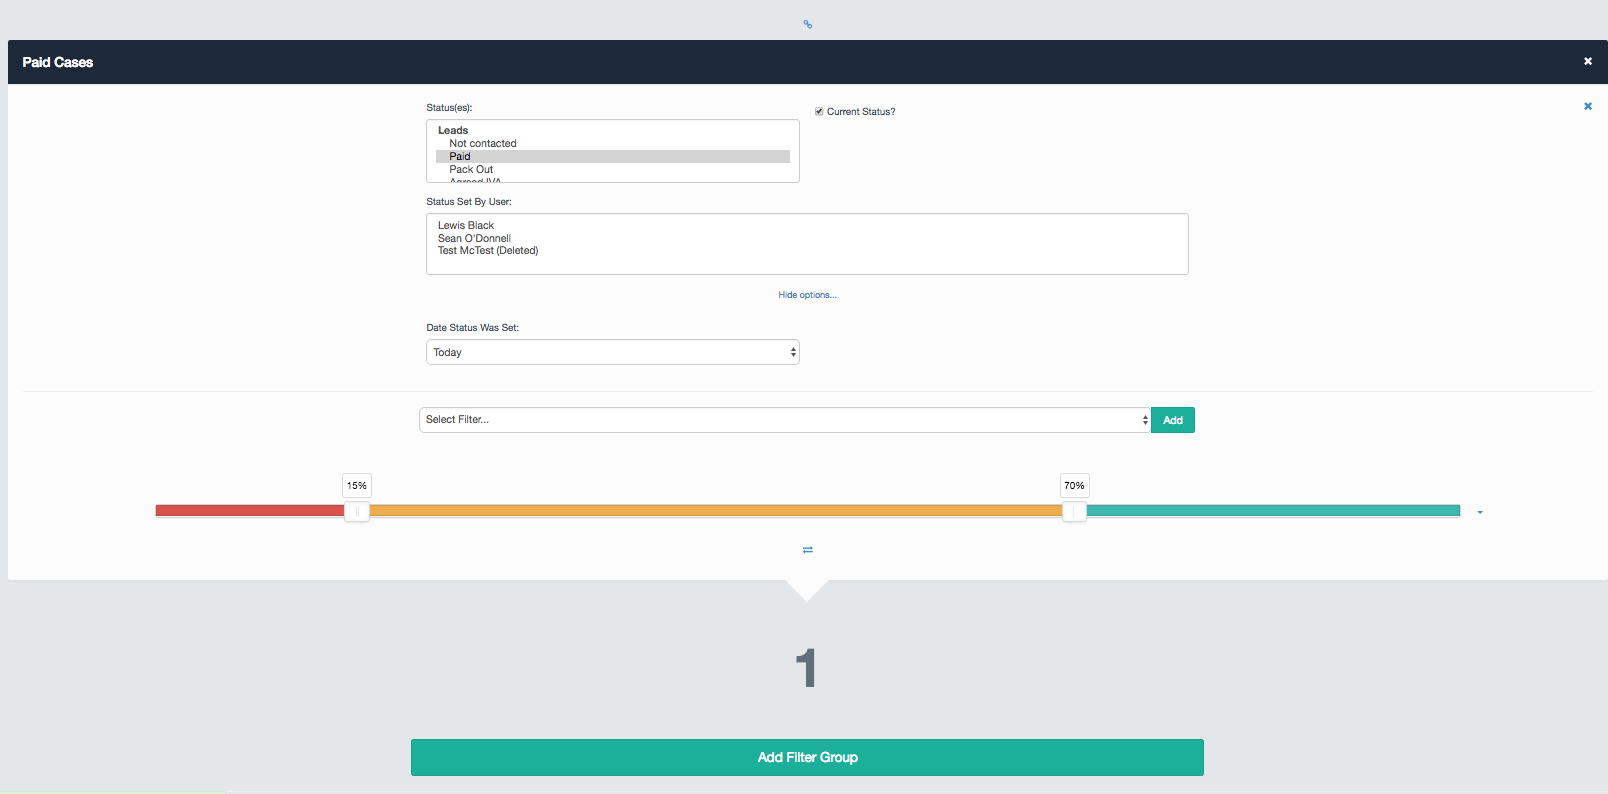
As you can see for this one I've set up a date filter, a status filter, ensured it's just the current status as the case shouldn't change status past this point for us and it is returning a value of one. This shows that we have one case that has been paid today that is still at the paid status. This since it is linked to our other filter group will also show the conversion. If you want to unlink filter groups you can click the chain/link icon just above the filter group.
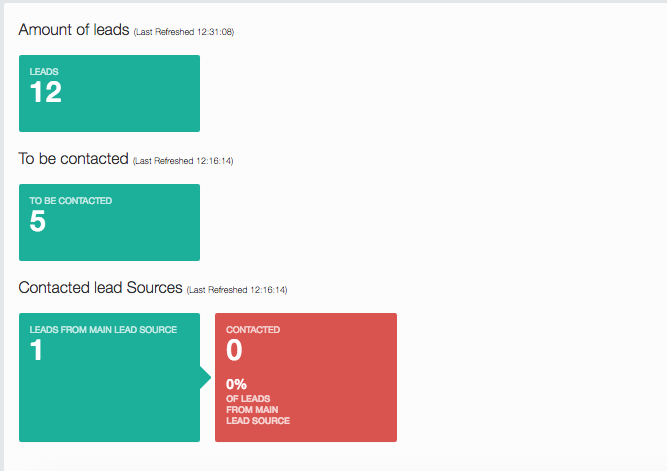
Block Colours
The percentages colour line at the bottom of the filter group is responsible for the blocks showing up a different colour on the homepage if the numbers are over a certain threshold.
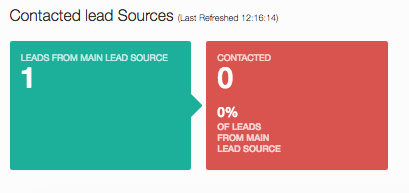
As you can see since our first Filter Group has a value and our second one is at a percentage of 0% it is showing up red.
Saving This Report
To save the report, you need to click the Save Report button at the very bottom of the page. Here you will be asked to enter a name and select which users you want this report to appear for.

As you can see, I've decided to share this report with myself and I've called it Packout to Paid so it's easily recognisable on my dashboard.
And that should be it! You'll now have a report showing on your dashboard (Keep in mind reports refresh every 15 minutes, so there may be some delay in it showing for the first time).
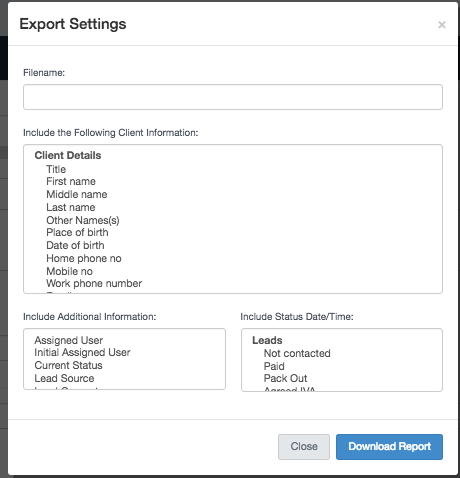
Exporting This Report
Should you want to export the data this report is using, you can go back into your saved reports and click on Report Settings. In here you can then scroll down to the bottom and click on Export Report. You can choose which columns of data you want such as the clients name, address, email, the user that is assigned to that case, the date it was created and even the date/time the status was set.
For further assistance, please check out the following article which also includes a demonstration video MI reporting or contact us by email - Helpdesk@hubsolv.com
Comments
0 comments
Please sign in to leave a comment.